0%

TiDB Alertmanager 告警配置

TiDB Alertmanager 告警配置

TiDB 中告警相关

告警规则

告警规则文件位于 monitoring 服务器 {deploy_dir}/conf/xxx.rules.yml

1
2
3
4
5
6
7
8
9
10
11
12
[tidb@test1 tidb-ansible_v3.0.5]$ cd /data2/gangshen/deploy/
[tidb@test1 deploy]$ ll conf/ | grep rules
-rw-r--r-- 1 tidb tidb 3612 Dec 4 14:32 binlog.rules.yml
-rw-r--r-- 1 tidb tidb 4684 Dec 4 14:32 blacker.rules.yml
-rw-r--r-- 1 tidb tidb 37 Nov 22 11:24 bypass.rules.yml
-rw-r--r-- 1 tidb tidb 2044 Dec 4 14:32 kafka.rules.yml
-rw-r--r-- 1 tidb tidb 471 Nov 22 11:24 lightning.rules.yml
-rw-r--r-- 1 tidb tidb 5358 Dec 4 14:32 node.rules.yml
-rw-r--r-- 1 tidb tidb 6898 Dec 4 14:32 pd.rules.yml
-rw-r--r-- 1 tidb tidb 5013 Dec 4 14:32 tidb.rules.yml
-rw-r--r-- 1 tidb tidb 16122 Nov 22 11:24 tikv-push.rules.yml
-rw-r--r-- 1 tidb tidb 15547 Dec 4 14:32 tikv.rules.yml

加载告警规则

prometheus 服务器通过配置文件中的 rule_files 字段加载告警规则文件

1
2
3
4
5
6
7
8
9
10
11
12
13
14
15
16
17
18
19
20
21
22
23
24
25
---
global:
scrape_interval: 15s # By default, scrape targets every 15 seconds.
evaluation_interval: 15s # By default, scrape targets every 15 seconds.
# scrape_timeout is set to the global default (10s).
external_labels:
cluster: 'gangshen-cluster'
monitor: "prometheus"

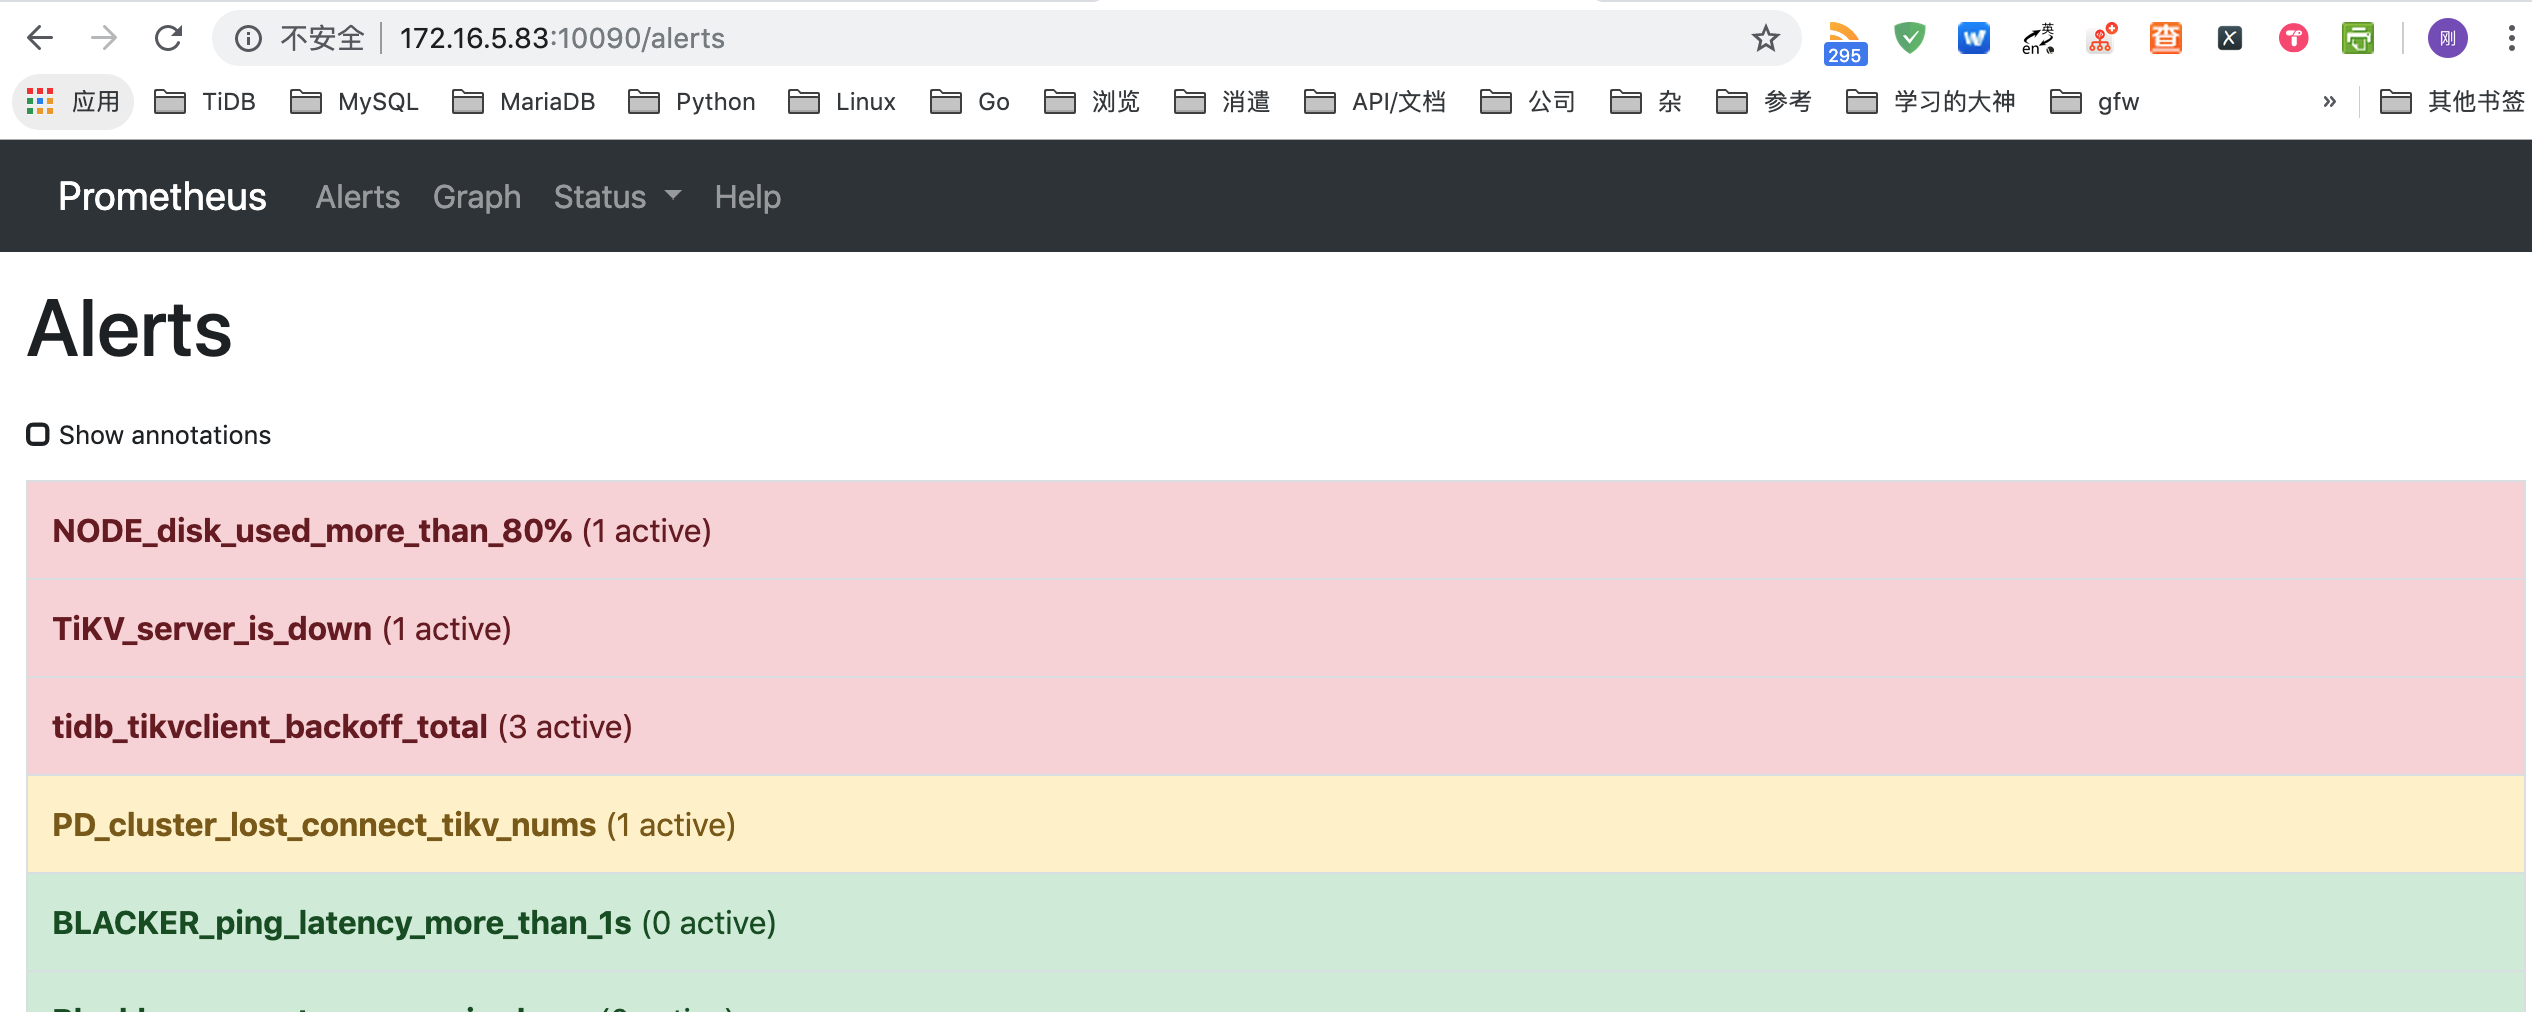
# Load and evaluate rules in this file every 'evaluation_interval' seconds.
rule_files:
- 'node.rules.yml'
- 'blacker.rules.yml'
- 'bypass.rules.yml'
- 'pd.rules.yml'
- 'tidb.rules.yml'
- 'tikv.rules.yml'

alerting:
alertmanagers:
- static_configs:
- targets:
- '172.16.5.83:10093'

······

重新加载规则

  • 方法1:重启 prometheus/alertmanager 服务
1
2
systemctl restart prometheus-{prometheus_port}.service
systemctl restart alertmanager-{alertmanager_port}.service
  • 方法2:通过 API 接口
1
2
curl -XPOST http://{prometheus_server}:{prometheus_port}/-/reload
curl -XPOST http://{alertmanager_server}:{alertmanager_port}/-/reload

部署 Alertmanager

  • 修改 inventory.ini 配置文件
1
2
[alertmanager_servers]
alert-1 ansible_host=172.16.5.83 alertmanager_port=10093 alertmanager_cluster_port=10094

如果需要配置自定义端口,需要配置 alertmanager_port 和 alertmanager_cluster_port 端口

小技巧,对于一些自定义变量或者端口可以在 tidb-ansible/role/{xxx}/template/{xx}.sh.j2

1
2
3
4
5
6
7
8
9
10
11
12
13
14
15
16
17
18
19
20
➜  tidb-ansible git:(master) cat roles/alertmanager/templates/run_alertmanager_binary.sh.j2
#!/bin/bash
set -e
ulimit -n 1000000

DEPLOY_DIR={{ deploy_dir }}
cd "${DEPLOY_DIR}" || exit 1

# WARNING: This file was auto-generated. Do not edit!
# All your edit might be overwritten!
exec > >(tee -i -a "{{ alertmanager_log_dir }}/{{ alertmanager_log_filename }}")
exec 2>&1

exec bin/alertmanager \
--config.file="conf/alertmanager.yml" \
--storage.path="{{ alertmanager_data_dir }}" \
--data.retention=120h \
--log.level="{{ alertmanager_log_level }}" \
--web.listen-address=":{{ alertmanager_port }}" \
--cluster.listen-address=":{{ alertmanager_cluster_port }}"
  • deploy
1
ansible-playbook deploy.yml -l alert-1
  • start
1
2
ansible-playbook start.yml -l alert-1
ansible-playbook rolling_update_monitor.yml --tags=prometheus

邮件告警配置

  • 修改 {deploy_dir}/conf/alertmanager.yml
1
2
3
4
5
6
7
8
9
10
11
12
13
14
15
16
17
18
19
20
21
22
23
24
25
26
27
28
29
30
31
32
33
34
35
36
37
38
39
40
41
42
43
44
45
46
47
48
49
50
51
52
53
54
55
56
57
58
59
60
61
62
63
64
global:
# The smarthost and SMTP sender used for mail notifications.
smtp_smarthost: 'smtp.qq.com:465'
smtp_from: 'xxxxx@qq.com'
smtp_auth_username: 'xxxxx@qq.com'
smtp_auth_password: '第三方授权码'
smtp_require_tls: false

# The Slack webhook URL.
# slack_api_url: ''

route:
# A default receiver
receiver: "db-alert-email"

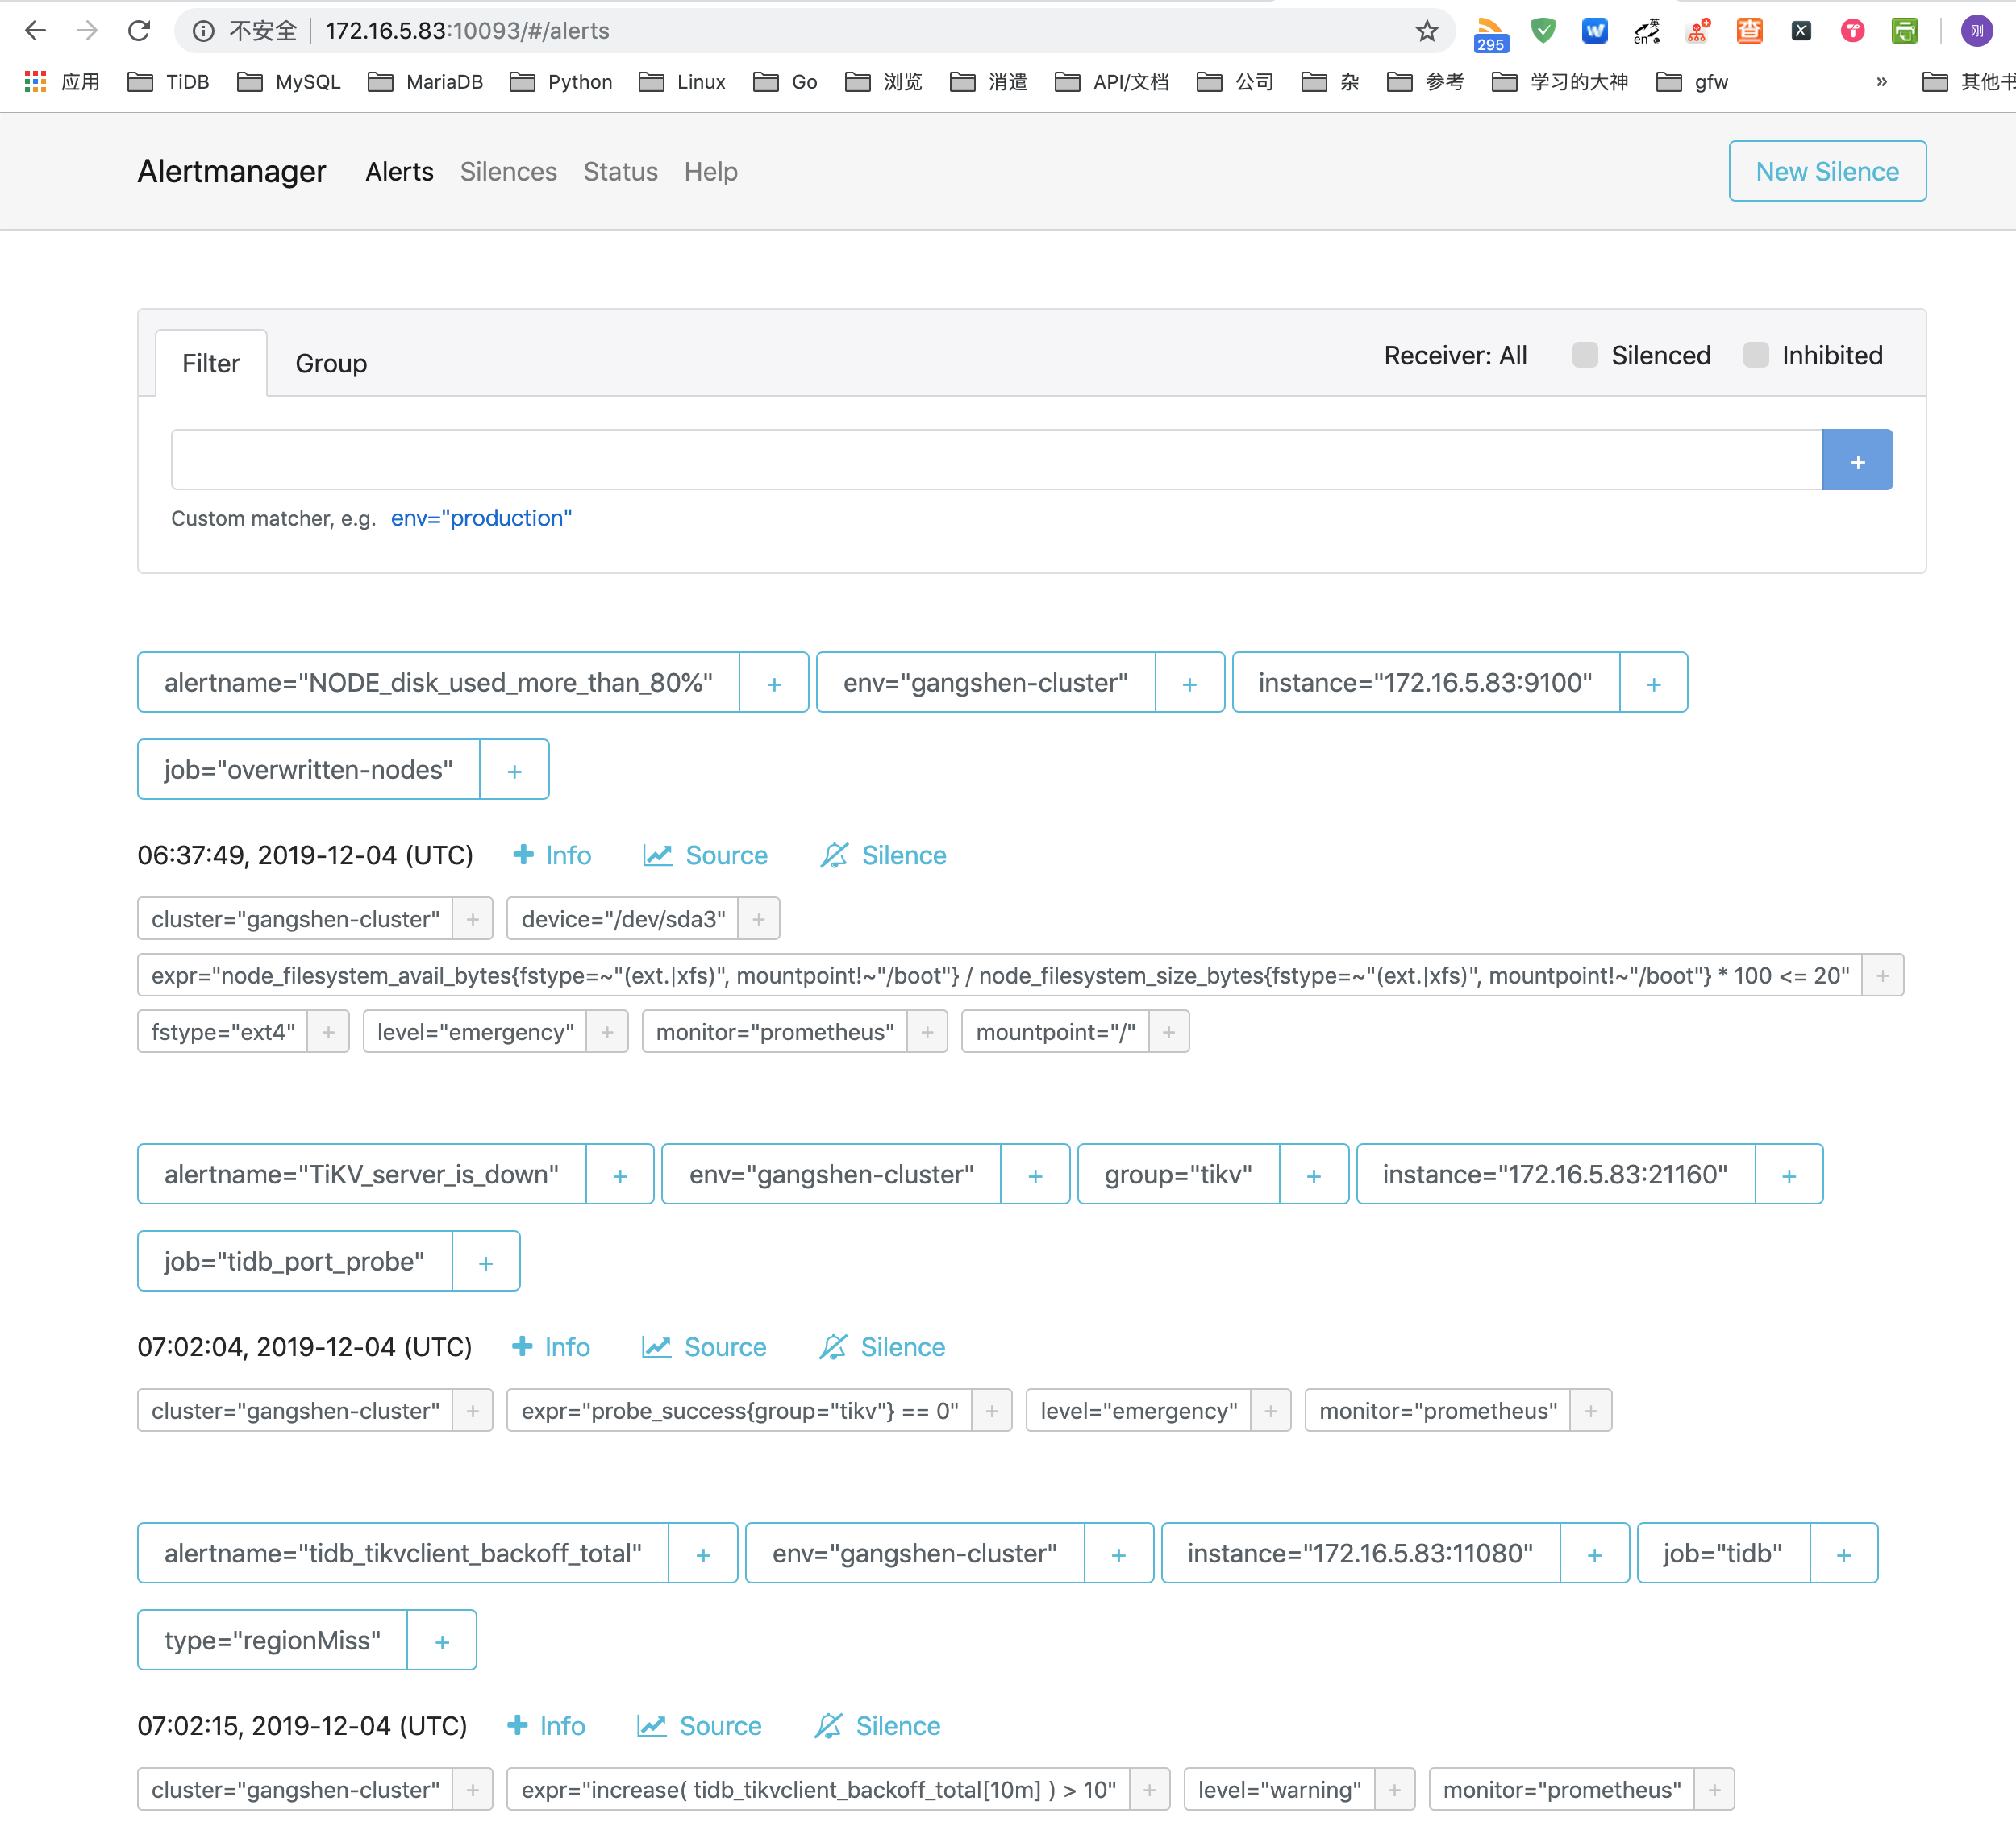
# The labels by which incoming alerts are grouped together. For example,
# multiple alerts coming in for cluster=A and alertname=LatencyHigh would
# be batched into a single group.
group_by: ['env','instance','alertname','type','group','job']

# When a new group of alerts is created by an incoming alert, wait at
# least 'group_wait' to send the initial notification.
# This way ensures that you get multiple alerts for the same group that start
# firing shortly after another are batched together on the first
# notification.
group_wait: 30s

# When the first notification was sent, wait 'group_interval' to send a batch
# of new alerts that started firing for that group.
group_interval: 3m

# If an alert has successfully been sent, wait 'repeat_interval' to
# resend them.
repeat_interval: 3m

routes:
# - match:
# receiver: webhook-kafka-adapter
# continue: true
# - match:
# env: test-cluster
# receiver: db-alert-slack
# - match:
# env: test-cluster
# receiver: db-alert-email

receivers:
# - name: 'webhook-kafka-adapter'
# webhook_configs:
# - send_resolved: true
# url: 'http://10.0.3.6:28082/v1/alertmanager'

#- name: 'db-alert-slack'
# slack_configs:
# - channel: '#alerts'
# username: 'db-alert'
# icon_emoji: ':bell:'
# title: '{{ .CommonLabels.alertname }}'
# text: '{{ .CommonAnnotations.summary }} {{ .CommonAnnotations.description }} expr: {{ .CommonLabels.expr }} http://172.0.0.1:9093/#/alerts'

- name: 'db-alert-email'
email_configs:
- send_resolved: true
to: 'shengang@pingcap.com'
  • 修改配置文件之后重启 alertmanager 服务或者重新加载配置文件
  • 触发告警之后,可以在 prometheus 中看到告警
  • 在 alertmanager 页面也可以看到告警
  • 并且可以在邮箱收到邮件